The Suite Dashboard is the central command center for your manufacturing business, giving you real-time visibility into sales channels, volumetric stocks, and operating inflows.
The Three Core Dashboards
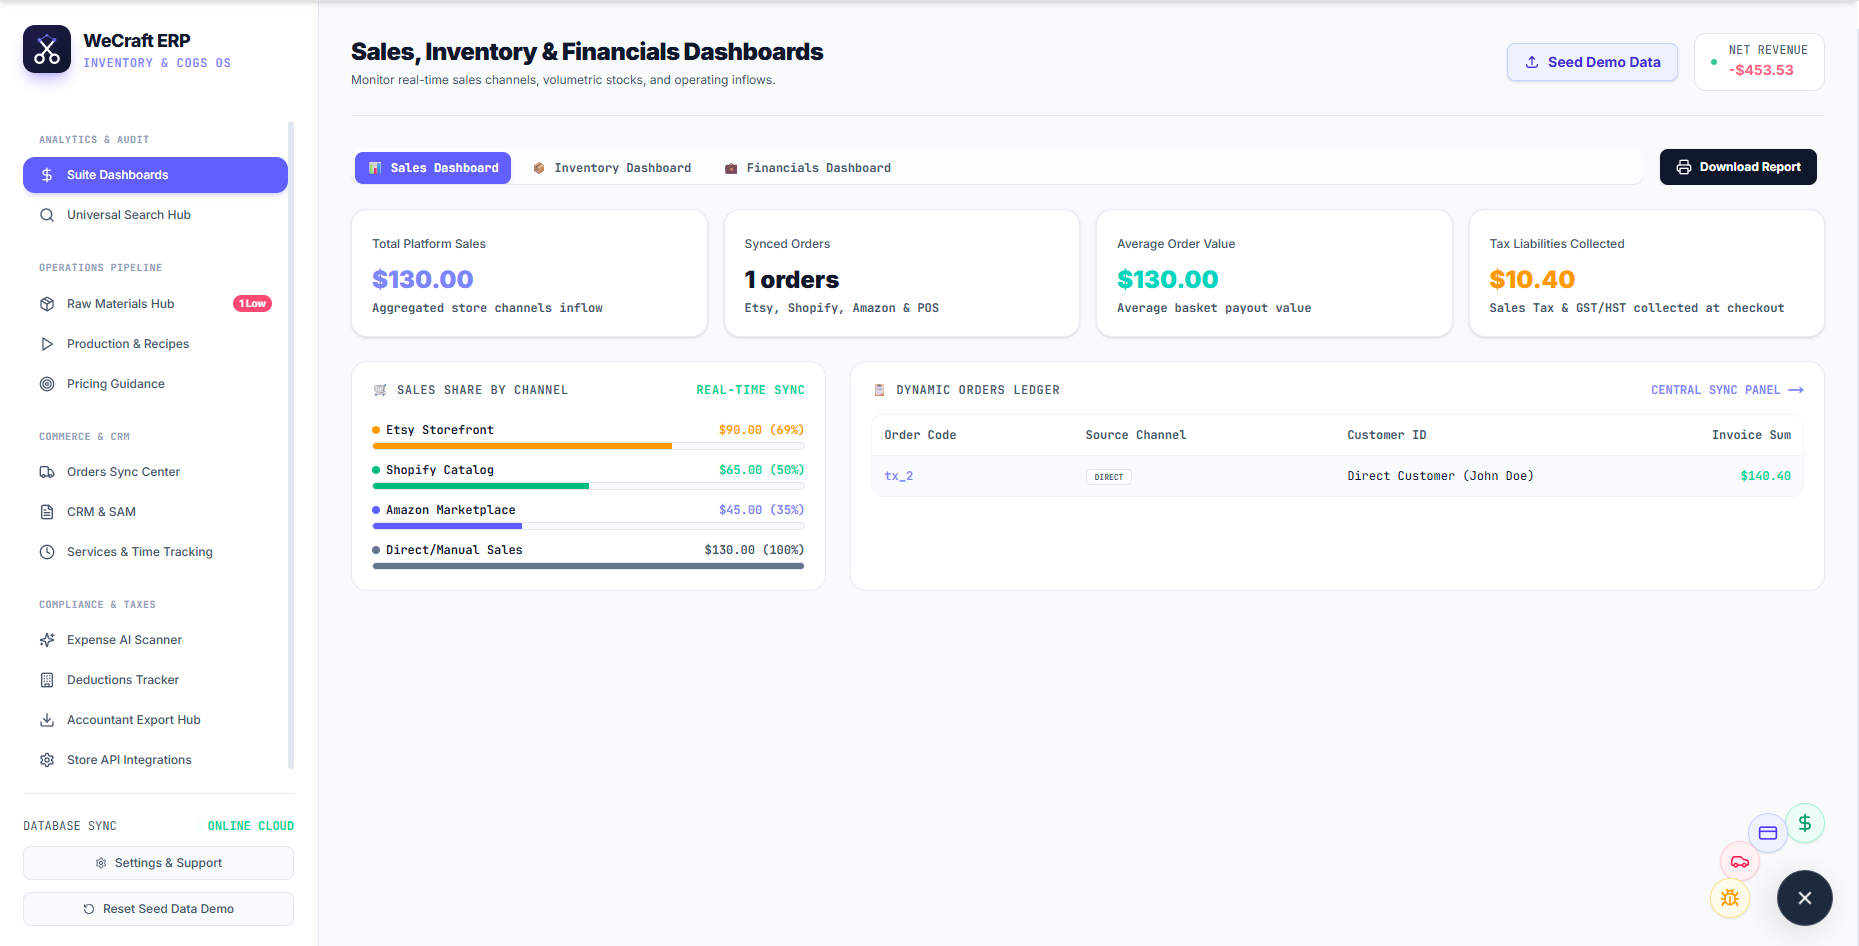
At the top of the interface, you can navigate between three specialized tabs: Sales Dashboard, Inventory Dashboard, and Financials Dashboard.
When viewing the Sales Dashboard, you'll see four primary KPI widgets:
- Total Platform Sales: The aggregated monetary value of all inflows across your connected store channels.
- Synced Orders: The total volume of orders pulled in from Etsy, Shopify, Amazon, and your manual Point-of-Sale.
- Average Order Value: Your average basket payout value.
- Tax Liabilities Collected: The total Sales Tax & GST/HST collected at checkout, helping you prepare for remittance.
Revenue Breakdowns & Ledgers
Below the top-line metrics, the dashboard provides a deeper dive into your revenue streams:
- Sales Share By Channel: A visual breakdown showing exactly what percentage of your revenue is coming from Etsy vs. Shopify vs. Amazon vs. Direct/Manual sales.
- Dynamic Orders Ledger: A real-time, central sync panel displaying every incoming order, its source channel, the specific customer ID, and the total invoice sum.
Global Navigation & Net Revenue
In the top right corner, you can always monitor your real-time Net Revenue. To explore other areas of the app like the Inventories & Warehouses or the Accountant Export Hub, use the comprehensive left-hand navigation sidebar. If you ever need to quickly locate a specific feature, the Universal Search Hub at the top of the menu is your best friend.